What’s My Current Customer Retention Rate?
What would it mean to your dealership financially if you were assured that all of your sales customers would remain service loyal and would likely purchase their next vehicle from your store?
How much more money would your dealership make each year?
That’s the question we are really trying to answer when it comes to your customer retention strategy. We can all agree that a service loyal customer is twice as likely to re-purchase at the store. What would your sales funnel look like if your sales to service retention was 70%? If you didn’t have to chase customers and seek out new buyers each month? How much money would you save? How much more money would you make?
Below we address the concept and reality of sales to service retention and how it can positively affect your bottom line. We also include data mining strategies we use at Performance Administration Corp. to help you map out potential ROI to build a strategy that reduces the cost of conquest and increases your net profitability.
What’s Your Current Retention Rate?
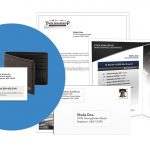
As a Customer Retention Firm in the Automotive Industry, we specialize in providing franchised dealerships with Current State Retention Assessments™ to provide dealer’san understanding of where they are now in terms of customer retention habits. We are the only maintenance providers to map out a retention blueprint to measure growth before and after maintenance program implementation.
We do this because we believe it’s important to measure your starting point so you can build a retention strategy and measure retention growth accurately. Once we have your current retention metrics we help your dealership build a custom maintenance strategy with measurable growth objectives and provide the tools to manage your program.
How To Find Your Current State Retention
Here is a list of data mining tactics we use to accurately identify franchise dealerships’ current retention rate. Once we have access to the DMS we use the information gathered from this list to generate a Current State Retention Report report.
What We Measure:
- Average gross profit for new and pre-owned vehicles
- Customer service activity within the first year of vehicle ownership
- CP labor gross profit
- Number of customers who repurchase from the dealership
|
Copyright 2015 Performance Administration Corp.© All Rights Reserved |
|
| Average gross profit per new vehicle | |
| Average gross profit per pre-owned vehicle | |
| Number of customers with 0 CPROs in first12months ownership | |
| Number of customers with 1 RO in first 12 months ownership |
|
| Number of customers with 2+ RO in the first 12 months of ownership | |
| CP labor gross profit amount for 0-1 visits | |
| Number of customers with multiple vehicle purchases (repurchases) | |
| Number of customers with only 1 vehicle purchase (single purchase) | |
What We Can Learn From This Information:
- Current retention for all cars sold: How many customers are service loyal?
- Missed service opportunities for 12 months: How many customers aren’t returning for service? How does that translate in terms of lost service income?
- Estimated ROI: What’s our actual ROI? What could our ROI be with higher service and repurchase retention rate?
Improving ROI ThroughSales Loyalty
and Service Loyalty
There are two distinct recurring revenue paths to measure and consider. The first is the vehicle sales loyalty as it relates to the original purchase and future purchases. The second is the service loyalty based upon RO visitation at your store during the period of time between vehicle purchases (i.e. year 1, year 2, year 3, year 4, etc). When a customer is both sales loyal and service loyal they have lifetime value.
Most dealerships we encounter have an average current retention rate of 25% and are therefore missing out on six figures worth of service gross profit within 12 months. After implementing a Complimentary Maintenance Strategy and measuring results after the first 12 months of ownership, we are on average able to double or triple dealership CP/RO Count and improve service retention from the initial 25% to 68%.
What WillResults Be For Your Dealership?
Find out today with a Current State Retention Assessment™.
